
























Excel sheet खुली है, लेकिन इतने numbers में कौन-सी बात पहले देखें, यह समझ नहीं आ रहा?
AI से केवल “data analyze करो” कहेंगे, तो जवाब broad हो सकता है। सही सवाल पूछें, तो cleaning, formulas और report का काम अधिक स्पष्ट बनता है।
यहाँ 15 ready-to-use prompts हैं जिन्हें copy करके अपने columns और goal के अनुसार बदल सकते हैं। साथ में एक reusable Master Prompt और छोटे dataset से result जाँचने का तरीका भी मिलेगा।
पहले sheet को सुरक्षित और समझने योग्य बनाएँ—वरना अच्छी दिखती report भी गलत total पर बन सकती है।
इस लेख में आप क्या सीखेंगे?
- Data की सुरक्षित तैयारी
- Cleaning और duplicate checks
- Formula के स्पष्ट prompts
- Sales और margin analysis
- Charts और report verification
- Reusable Master Prompt बनाना
Excel data analysis prompts इस्तेमाल करने से पहले
इन prompts को workbook पढ़ सकने वाले AI tool में इस्तेमाल करें। File upload उपलब्ध न हो, तो column headers और anonymized sample rows paste करें।
हर app या plan की capabilities अलग हैं। Microsoft की current Excel guide tables, formulas, PivotTables और charts के काम बताती है; access subscription और organization settings पर निर्भर हो सकता है।
Original file की copy पर काम करें। Customer names, phone numbers, account details और confidential salary data हटाएँ। केवल analysis के लिए ज़रूरी fields दें।
AI को metric का अर्थ बताएं। Sales, collected payment, profit और bank balance एक ही संख्या नहीं हैं। Blank cell का मतलब zero है या missing, यह भी स्पष्ट करें।
कम खर्च में शुरुआत चाहिए, तो free AI tools चुनने के practical checks देखें। File पढ़ने और सही analysis करने की क्षमता को अलग जाँचें।
इस छोटे sample से output की जाँच करें
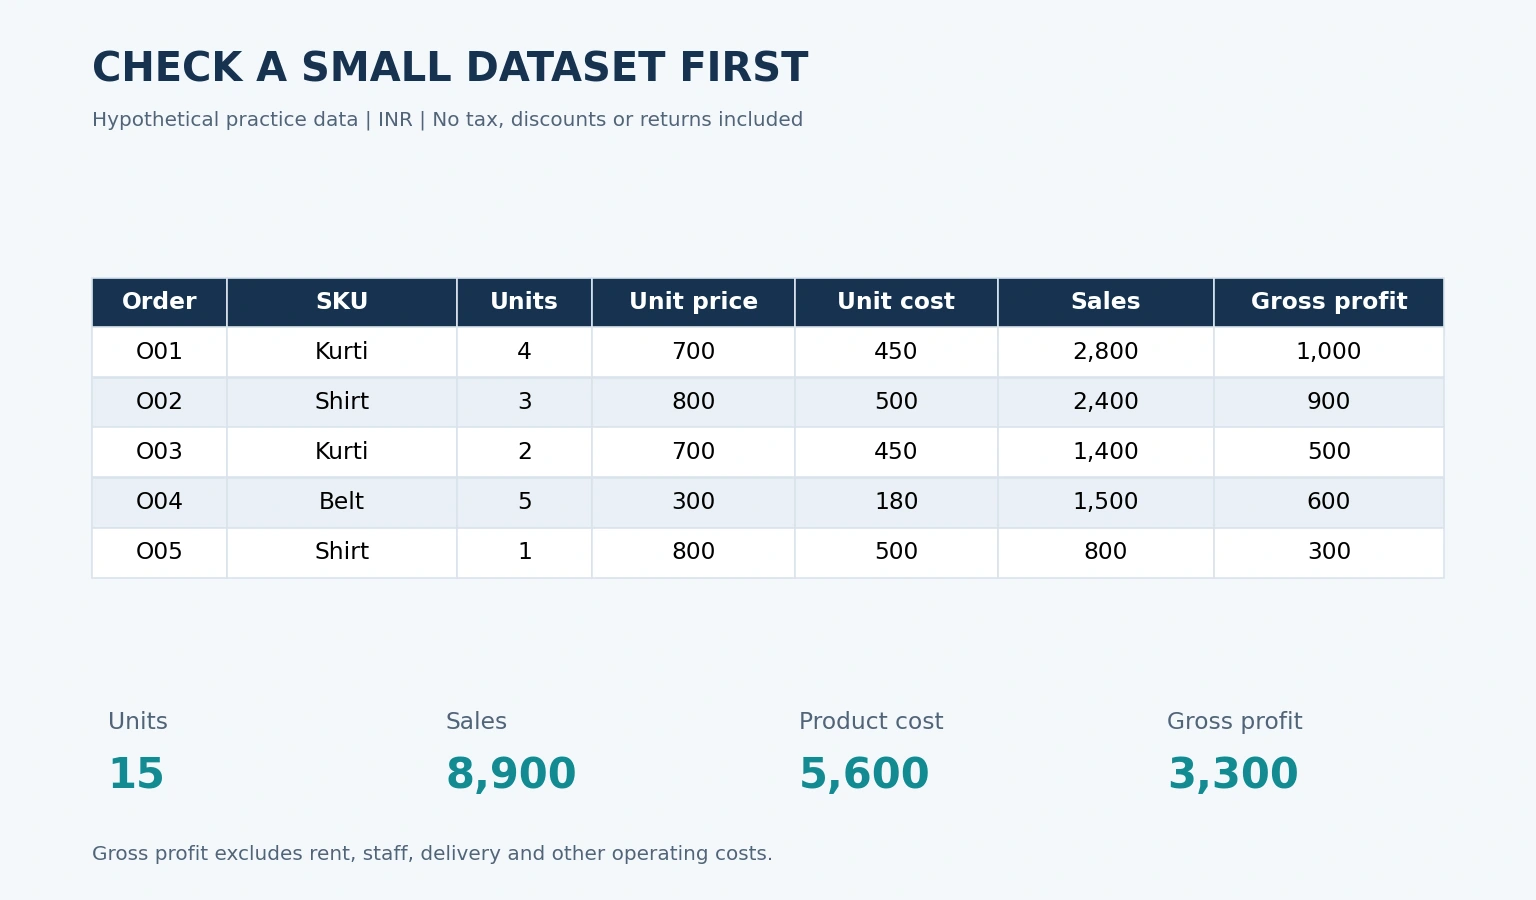
यह practice के लिए बनाया गया hypothetical sales data है। Prices tax से पहले हैं; discount और returns अभी शामिल नहीं हैं।
| Order | SKU | Units | Unit price | Unit cost |
|---|---|---|---|---|
| O01 | Kurti | 4 | 700 | 450 |
| O02 | Shirt | 3 | 800 | 500 |
| O03 | Kurti | 2 | 700 | 450 |
| O04 | Belt | 5 | 300 | 180 |
| O05 | Shirt | 1 | 800 | 500 |
इसे Excel में A1:E6 में रखें। Total units 15, sales ₹8,900 और product cost ₹5,600 होनी चाहिए। Gross profit ₹3,300 है; operating costs अभी नहीं घटाए गए हैं।
AI का output इससे match नहीं करता, तो आगे का dashboard बनाने से पहले वजह खोजें। Sample पर सही result आना पूरी workbook के सही होने की guarantee भी नहीं है।
Accounts का basic record समझना हो, तो दुकान का हिसाब व्यवस्थित करने की guide साथ रखें।
Prompt 1: Sheet को समझने वाला पहला audit
Best for: नई workbook मिलने पर
Inspect the supplied spreadsheet columns, sample rows and business question before calculating anything. Define the grain of the data: does one row represent an order, an order line, a payment or a customer? Give each column an expected type, unit and likely meaning. Flag ambiguous headers, mixed currencies, inconsistent dates, blanks and identifiers stored as numbers. Separate observations about the sample from claims that require the complete workbook. Return a schema table, five priority checks and the questions that must be answered before analysis. Include one example showing how a mistaken assumption about row grain could affect a total.
Sheet: [Sales]
Columns: [Order, SKU, Units, Unit Price, Unit Cost]
Sample rows: [Paste the five practice rows or an anonymized sample]
Goal: [Calculate sales and gross profit]
एक order में कई items हों, तो Order ID का repeat होना स्वाभाविक है। उसे audit के इसी stage पर duplicate बताकर हटाने न दें।
Prompt 2: Dates और numbers साफ करें
Best for: Text के रूप में रखी values ठीक करने में
Design a cleaning plan for the supplied worksheet. Identify inconsistent dates, currency symbols, extra spaces, text-formatted numbers and genuine missing values. For each issue, show the original value, proposed result, cleaning rule and whether human confirmation is required. Ask for the locale before interpreting a date such as 03/04/2026. Preserve the distinction between blank and zero. Use helper columns and specify formulas, references and expected error handling. Demonstrate the rules on five representative rows where available. Finish with a before-and-after check covering row counts, numeric totals and unresolved values.
Show how the proposed rule treats a genuinely empty cell and a cell containing spaces. Verify that identifiers with leading zeros retain their original representation.
Columns: [Date, Amount]
Locale: [India, DD/MM/YYYY]
Sample: [Paste anonymized rows]
Output: [Cleaning rules and helper formulas]
अगर dates अलग systems से आई हैं, तो सभी rows पर एक ही conversion rule लगाने से पहले original source जाँचें।
Prompt 3: Duplicate records की सही पहचान
Best for: Repeated order या imported rows जाँचने में
Find potential duplicates using the supplied business key. Distinguish identical rows from legitimate repeated transactions, multiple items in one order, refunds and split shipments. Explain where the proposed key can produce false matches. Flag candidates with a formula or conditional-formatting rule. Show a review table with row references, match reason, conflicting fields and a suggested human decision. Report observed row counts and candidate counts, and make any expected post-review count conditional on the decisions made. Include one matching example and one legitimate repeat. Preserve all original records for review.
Test the business key against two rows with the same order and SKU but distinct line identifiers. Explain whether the key needs an additional field.
Business key: [Order ID + SKU + transaction date]
Columns: [Actual column names]
Repeat context: [Multiple items may share one order ID]
Data: [Paste anonymized rows]
Duplicate हटाने से पहले backup और decision log रखें। गलत deletion अक्सर साफ दिखती sheet के पीछे छिप जाती है।
Prompt 4: Monthly sales summary बनाएँ
Best for: महीनों की तुलना में
Build a reproducible monthly sales summary. Calculate line revenue from units and unit price when those are the supplied definitions. Ask how discounts, taxes and returns should be handled when those fields exist. Show monthly units, revenue and unique orders. Explain how the unique-order method differs from counting order lines and identify any dependency on the Excel version. Label partial periods clearly. Recommend a PivotTable layout or formulas and reconcile the monthly totals to the source. Provide three observations grounded in the result and show the check used to verify the grand total.
Check whether the source covers every day of each month. Show the date bounds used to include transactions in the first and last month.
Date column: [Order date]
Order column: [Order ID]
Amount fields: [Units and Unit price]
Period: [Date range]
Data: [Paste anonymized rows]
एक महीने में दुकान कम दिनों खुली हो, तो केवल total sales से performance का निष्कर्ष कमजोर होगा।
Prompt 5: Product-wise gross margin देखें
Best for: High sales और useful margin अलग करने में
Calculate units, sales, product cost, gross profit and gross margin by SKU. Define each measure and divide gross profit by sales when calculating gross margin. Mark zero-sales margin as undefined and explain how returns or negative sales affect interpretation. Work through one practice row by hand, then provide formulas or PivotTable steps for the full table. Reconcile the SKU totals to the overall totals. Highlight products with high sales and relatively low margins. Keep rent, salaries and marketing outside gross profit unless the supplied metric explicitly includes them. List the stock, returns and demand evidence needed before making a product decision.
Show how to compute overall margin from total gross profit and total sales. Explain why averaging individual SKU percentages can distort that result.
SKU column: [SKU]
Price and cost: [Unit price, Unit cost]
Quantity: [Units]
Data: [Paste the article’s practice dataset or your own sample]
Sample में Kurti sales ₹4,200 और gross profit ₹1,500 है। इसी एक SKU से formula की दिशा जाँची जा सकती है।
Prompt 6: SUMIFS formula बनवाएँ
Best for: Condition के आधार पर totals निकालने में
Write a SUMIFS formula using the exact supplied ranges. Explain the criteria in plain English before showing the formula. Check that all ranges have matching dimensions and show how to keep references stable when copying. For date criteria, use an inclusive start and an exclusive next-period boundary and explain why that handles timestamps. State any locale-specific separator differences. Give a compatible alternative if the workbook version requires one. Provide expected results for matching rows, no match and a date exactly on the boundary. Label invented test rows as hypothetical and keep them separate from the actual result.
Sum range: [Sales!F2:F500]
Criteria range: [Sales!B2:B500]
Criteria value: [Kurti]
Excel locale: [Language and list separator]
Date filter: [Start date and next-period boundary, or none]
रेंज की rows बराबर रखें। पूरी column और छोटी range मिलाने से error या गलत result आ सकता है।
Prompt 7: Lookup में missing codes पकड़ें
Best for: SKU master से details लाने में
Design a lookup between the transaction sheet and product master using the supplied keys. Check whether each master key is unique and whether spaces, mixed types or leading zeros could affect matches. Provide XLOOKUP where supported and a compatible alternative when needed. Return REVIEW for missing keys and separately flag ambiguous duplicates. Test a valid match, a missing key and a duplicate master key. Explain which reference must stay fixed when copying the formula. Keep lookup outputs in helper fields. Preserve historical transaction prices and ask how historical records should be handled before suggesting any pricing update.
Explain whether an exact-match lookup can return the wrong product when the master contains duplicate keys. Give a separate duplicate-check formula.
Transaction key: [Sales!B2]
Master keys: [Products!A2:A200]
Return values: [Products!C2:C200]
Excel version: [Exact version]
Goal: [Look up category]
Lookup result मिल जाना key के सही होने का प्रमाण नहीं है। Leading zeros वाले codes को number में बदलने से सावधान रहें।
Customer या business data की सुरक्षा के लिए AI अपनाने से पहले privacy और cost checks लागू करें।
Prompt 8: PivotTable का layout चुनें
Best for: बिना complex formula report बनाने में
Design a PivotTable around the supplied business question. Map the source fields to Rows, Columns, Values and Filters. Explain which aggregations require Sum, Count, Average or a distinct count and why. State the data grain and show how the design avoids double-counting order lines. Give a version-compatible distinct-count method where applicable. Explain how to expand the source table, refresh the results and reconcile the grand total against the source. Suggest three practical views and identify any slices with too little data for a reliable interpretation. Include a compact example of the expected layout.
Show how to inspect the source rows behind an unexpected total. Explain which filter settings should be recorded so the result can be reproduced.
Question: [Sales by category and month]
Columns: [Date, SKU, Category, Units, Sales]
Filters: [Store or period]
Data grain: [One row per order line]
अगर Amount text है, तो PivotTable Sum की जगह Count दिखा सकती है। पहले data type ठीक करें।
Prompt 9: Returns के बाद net sales समझें
Best for: Gross और net totals मिलाने में
Reconcile the supplied sales and returns data. Confirm whether returns are stored as negative transactions or positive amounts in a separate table. Explain the matching keys and how to avoid subtracting a return twice. Build a bridge showing gross sales, discounts, returns and net sales under the supplied definitions. Identify unmatched returns and distinguish partial returns, cancellations and unpaid orders. Keep original transactions intact and show all reconciliation differences separately. Return a review list and one hand-checkable example. Describe which conclusions require accounting or tax verification before the figures are used for formal reporting.
Distinguish a refund posted after the original sale period from one posted in the same period. State the period convention used in the bridge.
Sales fields: [Column names]
Returns fields: [Column names]
Sign convention: [Positive returns in a separate table]
Period: [Date range]
Data: [Paste a redacted sample]
बैंक में मिले पैसे और sales की timing अलग हो सकती है। Net sales report को cash collection report का नाम न दें।
Prompt 10: Unpaid invoices की ageing देखें
Best for: Follow-up priority बनाने में
Build a receivables ageing report at the supplied as-of date. Distinguish invoice dates from due dates and confirm how paid, partly paid and disputed invoices should be treated. Calculate outstanding balances and group them into not yet due, 1–30, 31–60, 61–90 and over 90 overdue days. State which bucket includes an invoice due on the as-of date. Provide a formula and test at least two boundaries. Use anonymized identifiers and reconcile the bucket totals to the source balance. Suggest follow-up priorities based on recorded facts and flag disputed or missing information for review.
Show the result for an invoice due exactly 30 days before the as-of date and another due 31 days before it.
As-of date: [YYYY-MM-DD]
Columns: [Invoice ID, Due date, Amount, Paid amount, Status]
Data: [Paste anonymized rows]
आज की date अपने-आप इस्तेमाल करने से पुरानी report बदल सकती है। Reproducible report के लिए as-of date लिखें।
Prompt 11: Stock के लिए reorder संकेत
Best for: Fast sales और low stock देखने में
Prepare an inventory replenishment review using stock and recent sales. Show the observation period and how daily demand is estimated. Ask for lead time, safety stock and stockout days where those inputs are missing. Distinguish zero observed sales from zero demand when availability was limited. Explain a simple reorder point and calculate it using only supplied assumptions. Show current stock, estimated demand during lead time, buffer and review priority by SKU. Label the result as a planning suggestion. Note supplier minimums, seasonal effects and open purchase orders that could change the recommendation. Provide a check using one SKU before applying the calculation widely.
Show whether stock on order or reserved stock is included. If these inputs are missing, explain how that limits the replenishment recommendation.
Columns: [SKU, Current stock, Sold units, In-stock days]
Lead time: [Days]
Safety stock: [Units]
Period: [Date range]
Festival sales को पूरे साल का average बनाना overstock करा सकता है। Recent spike का context जोड़ें।
Stock और खर्च को साथ समझना हो, तो business management का पूरा workflow देखें।
Prompt 12: Budget और actual का variance
Best for: खर्च का अंतर समझने में
Compare budget and actual values by period and category. Use actual minus budget and state how favorable and unfavorable results differ for income and expenses. Report absolute and percentage variance. When budget is zero, label percentage variance as undefined and show the actual amount separately. Flag one-time entries and check whether periods, currencies and category names match. Reconcile the comparison to source totals. List material differences with supporting values, possible explanations as hypotheses and the next question needed to confirm each one. End with three prioritized follow-ups and use anonymized data throughout.
Identify which categories drive the aggregate variance. Explain whether offsetting differences could hide a large change in an individual category.
Columns: [Month, Category, Budget, Actual, Type]
Period: [Month or quarter]
Review threshold: [Absolute amount or percentage]
Data: [Paste rows]
सिर्फ़ budget से कम खर्च होना अच्छी बात नहीं है। ज़रूरी काम टला हो, तो performance पर असर अलग जाँचें।
Prompt 13: सही chart चुनें
Best for: Numbers को साफ दृश्य देने में
Choose a chart that answers the supplied question. Identify whether the goal is to compare categories, show a trend or explain composition. Give two suitable options and explain why one commonly chosen alternative would obscure the result. Specify axis labels, units, time period, sort order and baseline. Address missing data, partial periods and category count. Keep sales and profit clearly distinguished. Give a short chart specification that I can build in Excel, a one-sentence takeaway backed by the data and a source-total check. Label the practice values as hypothetical and preserve their exact values.
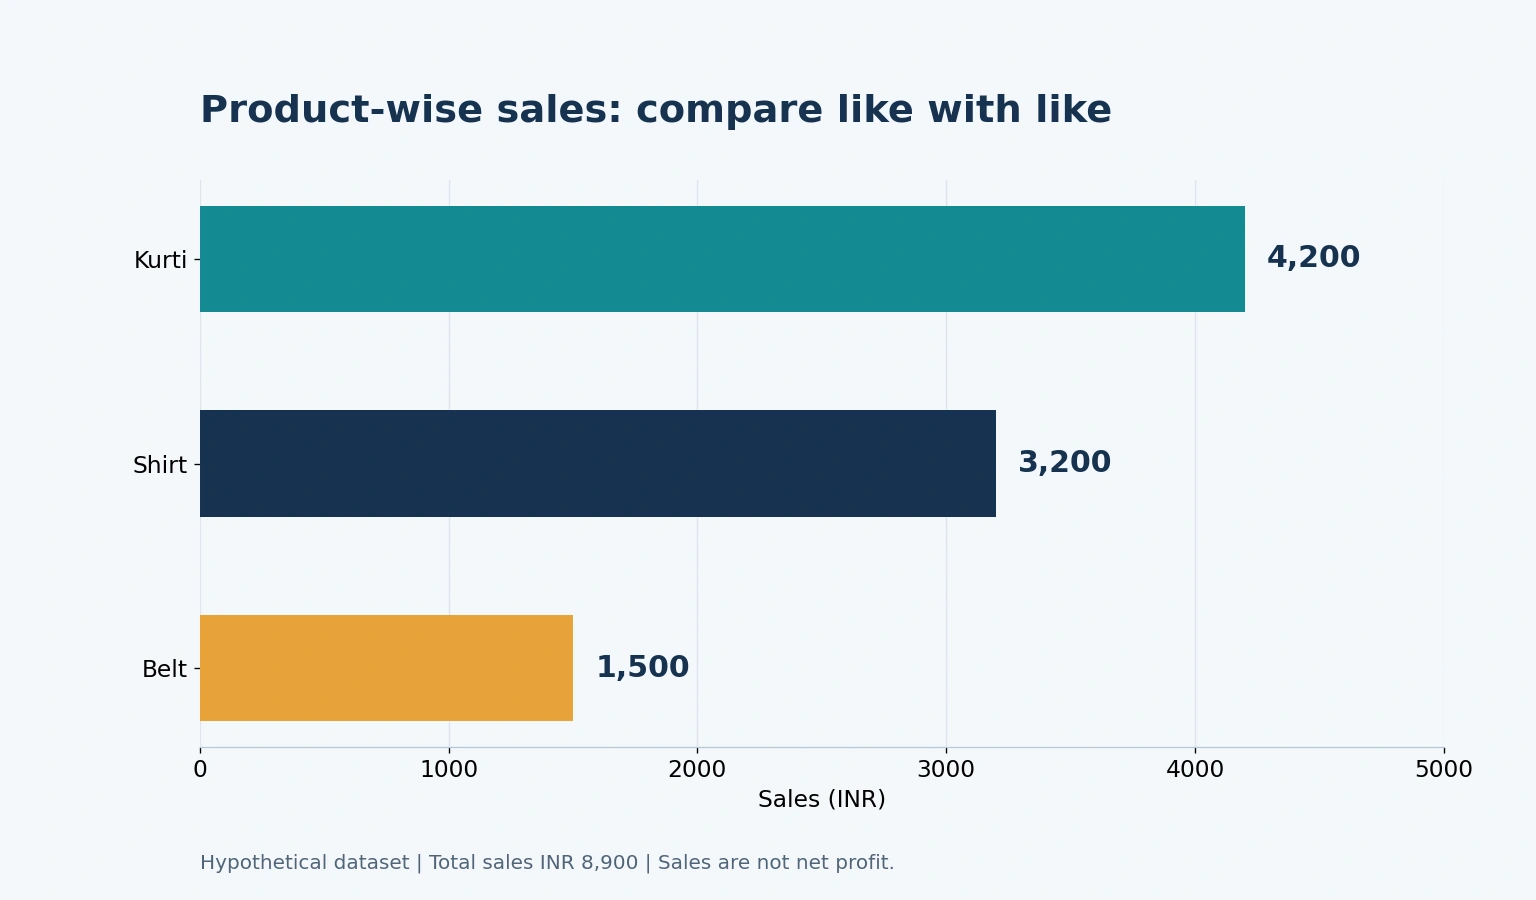
Question: [Compare sales by SKU]
Data: [Kurti 4200, Shirt 3200, Belt 1500]
Unit: [INR, hypothetical practice data]
Audience: [Small shop owner]
तीन categories के लिए साधारण bar chart अक्सर पर्याप्त है। केवल सजावट के लिए 3D chart जोड़ना reading कठिन कर सकता है।
Prompt 14: Unusual values जाँचें
Best for: गलत entry और असली exception अलग करने में
Create a review list for unusual values in the supplied fields. Separate violations of business rules from statistical outliers. Check negative units, impossible dates, extreme amounts and unit mismatches. Where useful, show the median, range and sample size. For every flag, include the source row, original value, rule or method and a question that would resolve it. Explain how small samples or legitimate exceptional events affect interpretation. Keep flagged records intact. Suggest corrections only when supported by the source evidence and mark unresolved entries for review. Include one example of a valid exceptional value.
Keep the original row number or stable identifier in the review output so every flagged record can be traced back without sorting the source.
Columns: [Numeric and date fields]
Business rules: [Allowed values and ranges]
Data: [Anonymized rows]
Output: [Review list with row references]
बड़ा order वास्तविक भी हो सकता है। Invoice या source record देखकर ही edit करें।
Prompt 15: Manager के लिए decision report
Best for: Analysis को उपयोगी next steps में बदलने में
Turn the verified analysis into a concise decision brief. Start with the date range, coverage and metric definitions. Give three supported observations and name the figure and source field behind each one. Explain which recommendation follows from each observation, who should act and when it should be reviewed. Label plausible explanations as hypotheses unless directly supported. Identify missing data and report any unreconciled differences. End with a short checklist for reproducing the calculations and a condition that would prompt a different decision. Use the requested report language and keep the evidence easy for a reader to trace.
For each recommendation, identify the smallest follow-up measurement that could show whether the action helped. Separate immediate actions from items awaiting evidence.
Verified totals: [Reconciled summary]
Decision: [What needs to be decided]
Audience: [Owner or manager]
Report language: [Hindi / English / Mixed]
Recommendation में “sales बढ़ाएँ” पर्याप्त नहीं है। कौन-सा छोटा test करना है और उसका result कब देखना है, यह लिखें।
अपना prompt कैसे बनाएँ?
सबसे उपयोगी क्रम है: business question → data structure → metric definition → calculation → validation → decision. Sheet upload करके केवल “insights दो” कहने से यह context नहीं मिलता।
Range और units बदलें, लेकिन calculation की verification न हटाएँ। नया column जोड़ें, तो output में उसका मतलब और source भी दर्ज करें।
Bonus: reusable Master Prompt
Analyze the supplied spreadsheet to answer the stated business question. Begin by identifying the data grain, columns, units, date range and missing values. Ask up to five focused questions if the answers could change a calculation or interpretation. Confirm each metric definition before choosing formulas or a PivotTable.
Work from an unchanged source and explain which steps belong in helper columns, a working sheet or a summary. Use the exact ranges and Excel version where supplied. Explain how blanks, zero values, duplicate candidates and partial periods affect the result. Mark unresolved records explicitly and avoid making corrections without evidence.
Show reproducible calculation steps, compatible formulas or a PivotTable layout. Include row references and hand-checkable tests. Reconcile the result to any known source total and report unresolved differences. Distinguish observed facts from hypotheses. Summarize the decision, the evidence behind it and the smallest next check. Do not invent missing transactions, causes or figures, expose confidential identifiers, delete records or perform external actions.
Business question: [Exact question]
Sheet and columns: [Names and ranges]
Sample or workbook: [Anonymized data]
Metric definitions: [Exact measures]
Excel version and locale: [Version and settings]
Output: [Formula / PivotTable / Decision brief]
Validation total: [Known source total or unknown]
Report language: [Hindi / English / Mixed]
Report स्वीकार करने से पहले पाँच सवाल
क्या source row count वही है? क्या blank और zero अलग हैं? क्या total manual check से मिलता है? क्या returns दो बार नहीं घटे? क्या recommendation डेटा से आगे दावा तो नहीं कर रही है?
जवाब साफ न हों, तो chart export रोकें। पहले छोटी sample range पर formula और expected result मिलाएँ।
कई AI tools की memberships लेने से पहले usable output के आधार पर budget बनाएँ। Basic formula task के लिए महँगा plan हमेशा ज़रूरी नहीं है।
आज से क्या करें?
- एक redacted practice sheet की copy बनाएँ।
- Prompt 1 से schema audit और Prompt 5 से margin check करें।
- तीन rows हाथ से calculate करके AI result मिलाएँ।
- एक decision brief बनाएँ और unresolved points लिखें।
आख़िर में एक छोटी सी बात
Excel में AI का अच्छा उपयोग केवल तेज जवाब नहीं है। उसका उपयोग ऐसा calculation बनाना है जिसे आप समझ और दोबारा जाँच सकें।
एक छोटी sheet से शुरू करें। Verified totals और साफ assumptions मिलें, तभी बड़े report पर जाएँ।
आप sales, stock या खर्च में से किस sheet का analysis करना चाहते हैं? अपना use case बताएँ और prompts उपयोगी लगें, तो comments में अपनी राय दें।